In 2017, more than 40,000 people died in the U.S. as a result of automotive accidents. In 2016, that figure was slightly higher, marking the deadliest year on American roadways since 2007.
Falling asleep at the wheel, distracted driving, and failing to heed proper signals account for a majority of avoidable motor vehicle accidents, resulting in thousands of fatalities and serious injuries every year.
Before heading out on the road again, shouldn't you know how many fatal accidents have occurred in your county and state? To learn more, we analyzed data from the Fatality Analysis Reporting System by the National Highway Traffic Safety Administration to determine where and how fatal motor accidents occurred from 2010 through 2016. Read on as we break down the worst drivers in America.

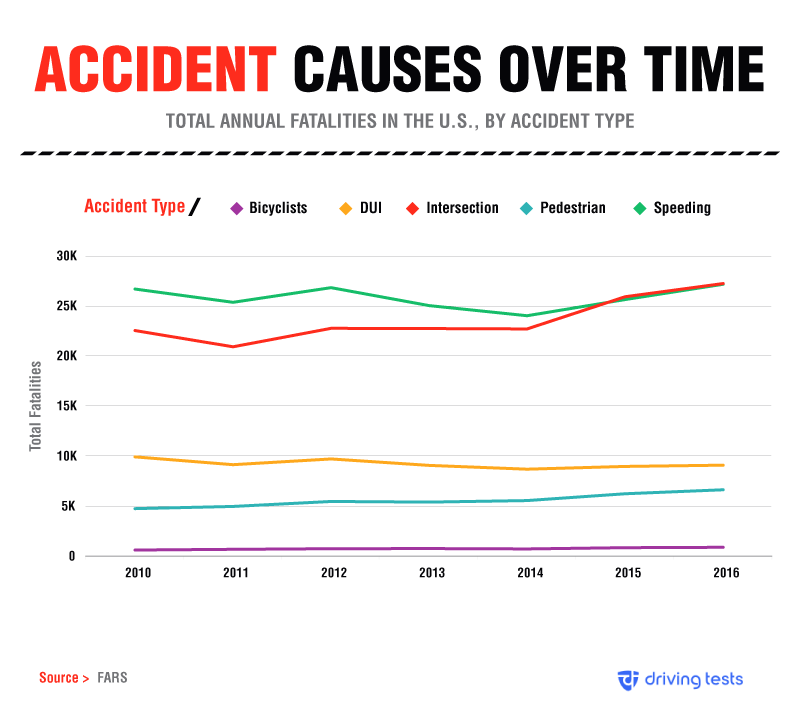
Since 2010, speeding has accounted for the vast majority of automobile fatalities in the U.S. In 2012, over 26,800 deadly crashes - more than half of total fatalities that year - were attributed to a driver traveling in excess of the speed limit. Beyond controlling your speed relative to other drivers on the road, speeding puts drivers at risk during adverse weather conditions. If you don't accurately anticipate icy or wet driving conditions, you may not have enough time to slow down before losing control of your vehicle.
While speeding has been attributed to roughly 1 in 3 motor vehicle fatalities over the last two decades, one accident type surpassed it as the leading cause of death in 2016: intersection collisions. Unlike one-way lanes, there are multiple points (including head-on) where collisions can occur between drivers passing from opposite directions. In 2016, more than 27,000 people died as a result of intersection collisions.
The number of fatalities attributed to impaired drivers and DUIs has remained relatively consistent over the last six years, however. In 2016, more than 9,000 people died from car accidents involving drivers over the legal drinking and driving limit.

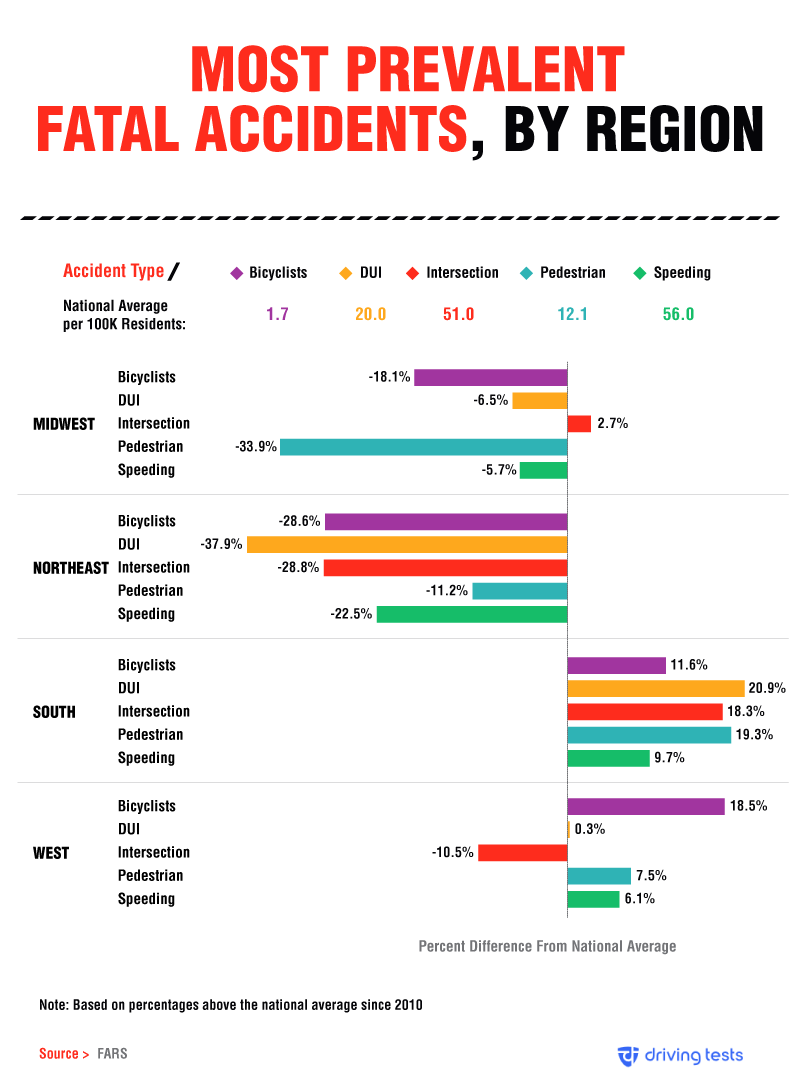
While the national traffic fatality average has fluctuated slightly year after year, the types of accidents resulting in the highest number of traffic fatalities are different in every region.
In the South, DUI-related fatalities surpassed the national average by nearly 21 percent. Nationwide, the number of drunk-driving fatalities reached an all-time low in 2014, but drunk driving still claims the lives of thousands of Americans every year. New preventative measures like ride-sharing services (including Uber and Lyft) to avoid impaired driving have been shown to help reduce the number of DUI fatalities in some cities, but it doesn't work everywhere. Other studies suggest the most effective ways to prevent drunk driving typically involve sobriety checkpoints and ignition interlocks, but industry-sponsored programs rarely implement these efforts.
Fortunately, automobile fatalities involving pedestrians dropped further below the national average in the Midwest than in any other region. In 2017, the number of pedestrian deaths reached a 33-year high, and 3 in 4 occurred after dark. To help combat this, experts say physical changes to roadways (including curb extensions and lighting improvements) may be necessary.

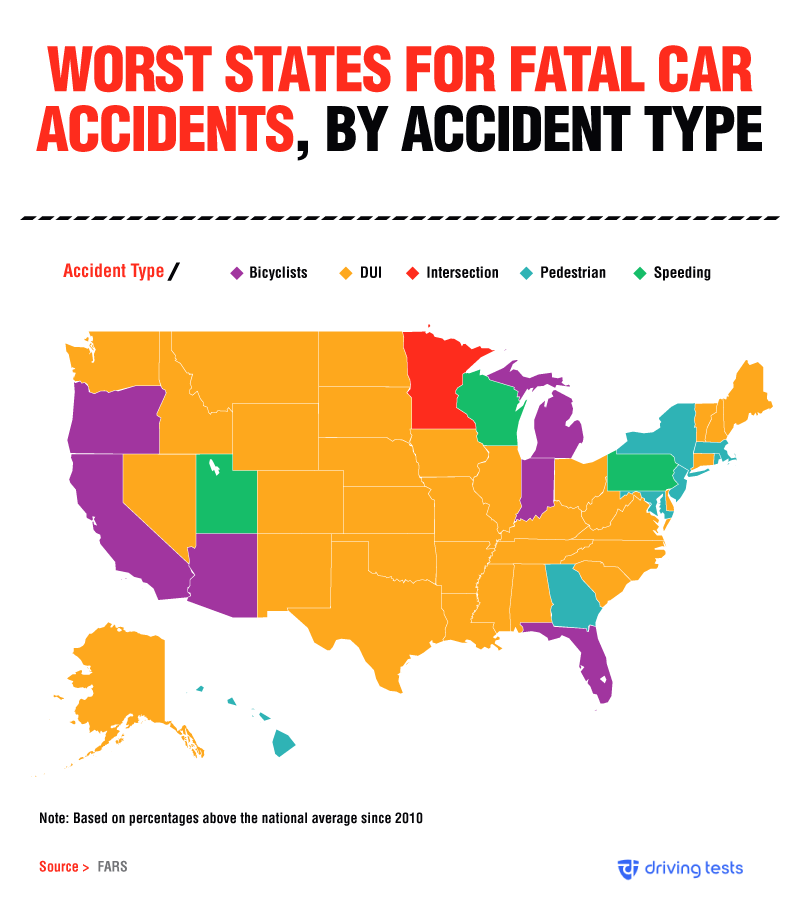
Depending on where in the U.S. you live, certain driving trends, weather patterns, and even roadway conditions could impact the crashes that often lead to severe injury or death. Here, our map illustrates the leading cause of accident fatalities in every state since 2010.
In some parts of the Northeast, like Maine, Vermont, and New Hampshire, the rate of deaths attributed to impaired drivers and DUIs was further above the national average than any other fatality type. While fatal intersection collisions have risen steadily since 2010, Minnesota was the only state in which this fatality type most egregiously surpassed the national average.
In several states, including California, Oregon, and Florida, the rate of automobile fatalities involving a bicyclist was above the national average. Studies have shown alcohol is a factor in more than 1 in 3 bicycle fatalities, of which the riders account for 22 percent of the drinking. Distracted driving also contributes to the number of people killed on bikes each year, and more than half of cyclists who die aren't wearing helmets at the time of their accidents.

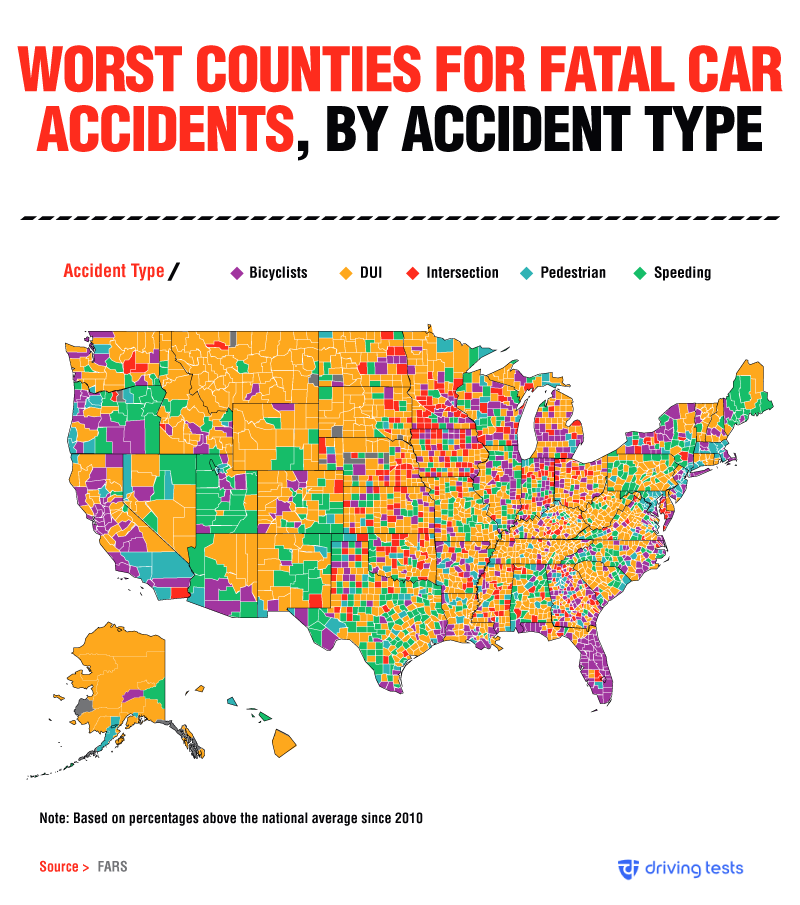
Want to know which accidents fatalities might be most prevalent in your area? Our map helps illustrate which counties have had certain types of vehicle fatalities above the national average.
In much of Florida, fatalities involving bicyclists were well-above the national average, except in Hardee and DeSoto counties, where DUIs were more commonly associated with deadly traffic accidents, and in Highlands and Glades counties, where intersection collisions were more prevalent.
And while DUIs in parts of Texas were certainly above the national average, that wasn't true statewide. Accidents involving speeding were almost just as likely (in Freestone and Parker counties, for instance). Pedestrian accidents weren't the most common type of traffic fatality overall, but they have occurred more frequently in Southern California counties like San Bernardino and Los Angeles than in other parts of the country since 2010.
Practice Makes Perfect
Across the country, thousands of people die every year from preventable automobile accidents. From collisions in intersections to speeding and impaired driving, the rate of these fatalities has been on a steady incline for the last 10 years. Depending on where you live in the U.S., you might find that specific types of accidents are more common than others.
At Driving-Tests, our passion is a reimagined approach to online education. Our free website offers users the chance to take DMV practice tests that are just like the real thing. These practice exams are meant to maximize your study time by helping you answer questions similar to the ones you'll take on the actual test. Ready to dive in? Visit us at Driving-Tests.org to learn more.
Methodology
We collected data from the Fatality Analysis Reporting System, a census of fatal crashes prepared annually by the National Highway Traffic Safety Administration, as of January 2018. These data are available for public use. Our analysis included information from 2010 through 2016, the most recent span of data available at the time of this project's completion.
This project did not entail statistical testing, so the findings presented above are based on raw totals and averages alone. Accordingly, this content should be interpreted as exploratory, and future studies of this subject should incorporate further statistical analysis.
Fair Use Statement
Want your local following to know the accidents they may be most at risk for? Feel free to share this information so long as it's for noncommercial purposes, and you link back to this page so its contributors can receive proper credit.


